Internet Facts and Statistics 2025
Internet usage and availability in the United States
Jul 14, 2025 | Share
Data and Research, Featured
Understanding how and why we use the internet is vital to making sense of today’s world, and we’ve seen enormous changes over the last few decades. In 2025, more than 93.1% of Americans say they use the internet—that’s 332 million people, up by 51 million since 2015. Still, about 9.78 million Americans don’t use the internet, and more than 5 million households don’t have a computer.
85% of Americans consider the internet a utility, just like electricity, gas, or water.
Digital access across the U.S. is evolving, but your experience depends greatly on where you live, your household budgets, your devices, and why you log on. This report covers the most important internet trends and statistics based on thousands of proprietary speed tests, custom surveys, official government data, and academic research.
Table of contents
- Internet upload and download speeds
- Who has access to high-speed internet
- Monthly prices for home internet service
- How people use the internet in their daily lives
Internet speed in the U.S.
As new internet connection types become available and providers improve infrastructure nationwide, internet speeds are getting faster for everyone. That’s good because our demands on internet speed are growing all the time.
But why do you need fast internet? Because faster internet means smoother browsing, streaming, gameplay, and file management.
Our readers check their actual internet speeds using our proprietary tools an average of 45,000 times a day, and here’s what we clocked in 2024:
- The average download speed in the U.S. is 209.01Mbps.
- The average upload speed in the U.S. is 61.98Mbps.
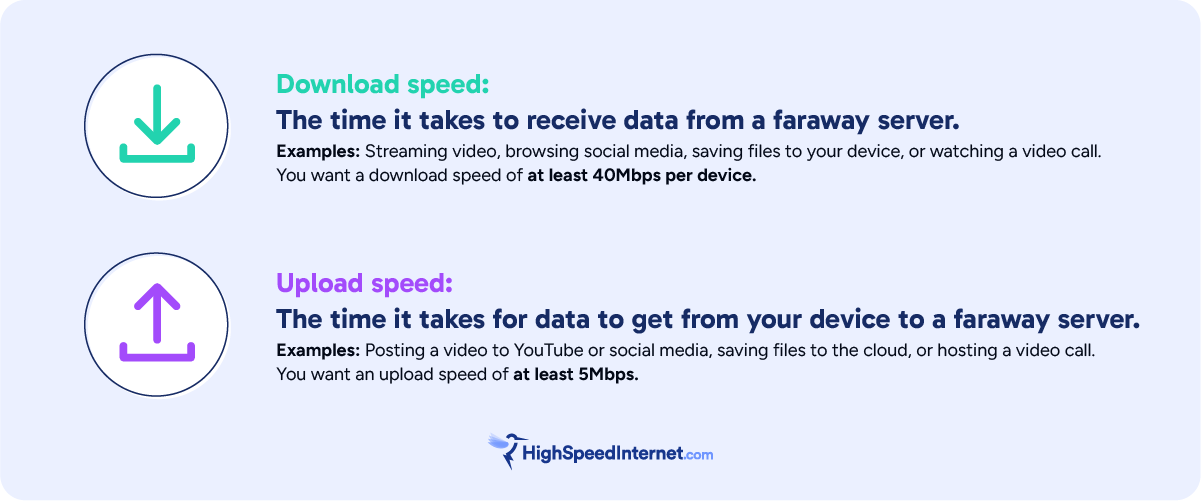
For reference, internet speeds are measured by how many megabits or gigabits of data are transferred per second (Mbps or Gbps), and upload and download speeds are calculated separately.
If you don’t know how much speed you’re getting, don’t stress! You can find out in seconds by clicking or tapping on the button below.
Download speed
000 Mbps
Upload speed
000 Mbps
Latency (ping)
00 ms
Jitter
00 ms
Internet speeds required for common online activities
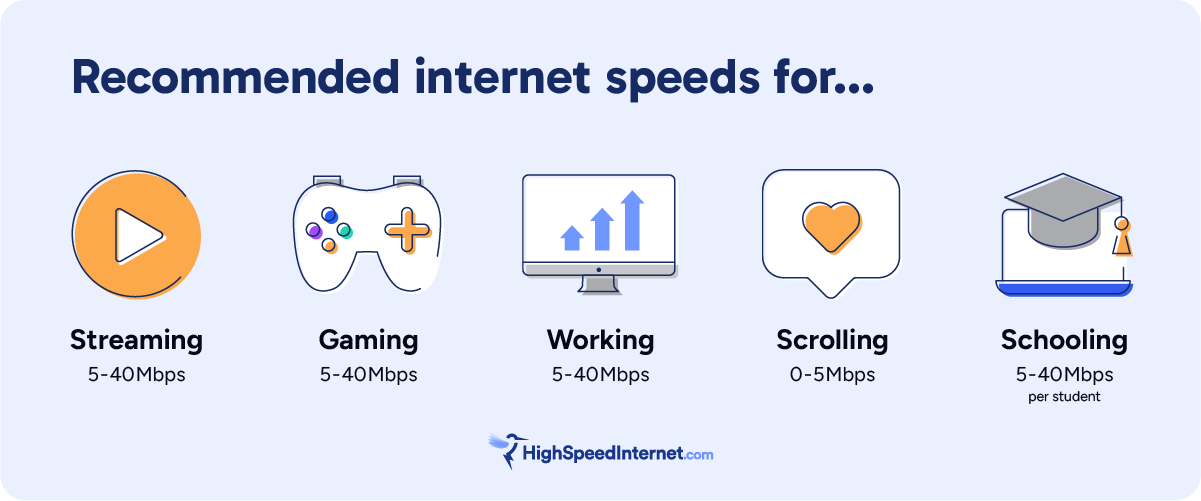
Different online activities require different speeds. You don’t need fast speeds for checking emails or browsing Facebook, for example, but you need a lot if you’re streaming in 4K, hosting a large video call, editing video in the cloud, or gaming in virtual reality.
Having faster speed also means you have more network capacity (bandwidth), so you can connect more devices at once.
In other words, you need enough speed for specific activities on each device and enough speed to support all the devices on your internet connection.
How much speed do you need?
When you’re comparing internet speeds, there are two big things to think about: which activities you’re doing and how many users or devices you have.
Here’s a handy chart to help you figure out how much speed you need.
| Internet download speed | Works for | Ideal number of connected devices |
|---|---|---|
| 0–5Mbps | - Checking email - Streaming music on one device - Searching on Google | 1–2 |
| 5–40Mbps | - Streaming video on one device - Video conferencing with Skype or FaceTime - Online gaming for one player | 3–4 |
| 40–100Mbps | - Streaming HD video on a few devices - Multiplayer online gaming - Downloading large files | 5–7 |
| 100–500Mbps | - Streaming video in UHD on multiple screens - Downloading files quickly - Gaming online for multiple players | 8–10 |
| 500–1,000+Mbps | - Doing a lot of almost anything on numerous devices simultaneously | More than 10 |
Internet speeds required for common online activities
Internet speeds across America
The internet speeds you can get depend on your internet connection type, and that varies based on where you live. Urban and suburban areas are most likely to have fiber internet, which means incredibly fast speeds and reasonable monthly pricing. Rural areas tend to have only cable or DSL internet, which is slower and more expensive. In particularly rugged areas, you might have to rely on fixed wireless or satellite internet.
Here’s a look at how average speeds compare in different regions, based on our proprietary speed test data:
- The states with the fastest internet speeds are Connecticut, New Jersey, and Florida.
- The states with the slowest internet speeds are Alaska, West Virginia, and Montana.
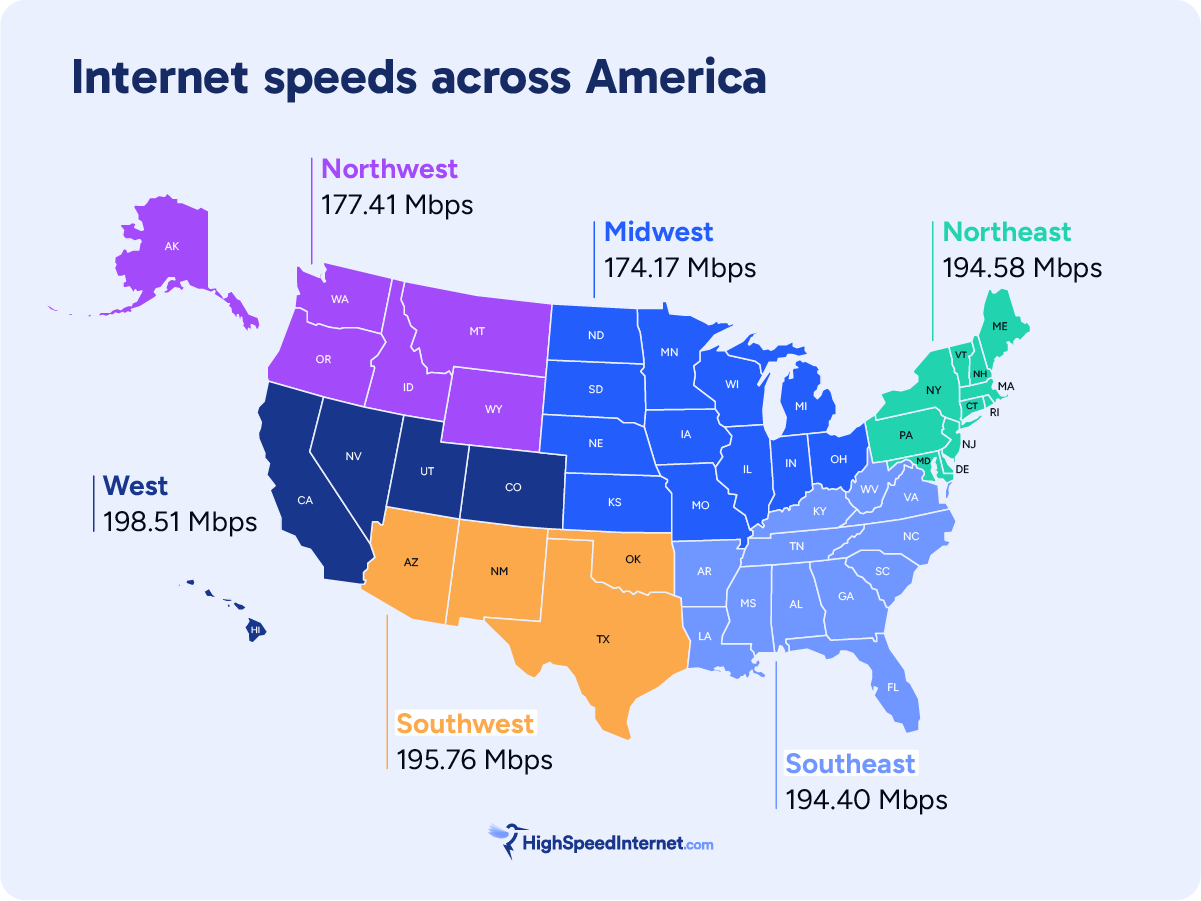
- The average internet download speed in the Northwest is 177.41Mbps.
- The average internet download speed in the West is 198.51Mbps.
- The average internet download speed in the Southwest 195.76Mbps.
- The average internet download speed in the Midwest is 174.17Mbps.
- The average internet download speed in the Southeast is 194.40Mbps.
- The average internet download speed in the Northeast is 194.58Mbps.
Speeds and connection types vary widely—you might not have the same infrastructure as houses on the next street or in the next town. The only way to know what speeds you can get is to find internet providers in your area, enter your address, and compare plans.
Ready to find internet providers near you?
Enter your zip code to shop and compare.
Computer and internet access in America
The digital divide is closing, but the U.S. Census Bureau reports that 7.8% of households still didn’t have a home internet connection in 2023. That’s down from 22.8% in 2015, but it still means more than 10 million households told the government they don’t subscribe to any home internet service.
Meanwhile,
the Federal Communications Commission reports 94.53% of all areas studied have access to broadband speeds with at least 100Mbps of download speed and 20Mbps of upload speed.
There’s a pretty big gap between the percentage of households that could get fast internet and the percentage of households that do get it, but it points to a larger truth. For everyday Americans, internet access is complicated by cost, availability, and tech skills. It’s a lot to think about, but here’s what we learn from our in-house data:
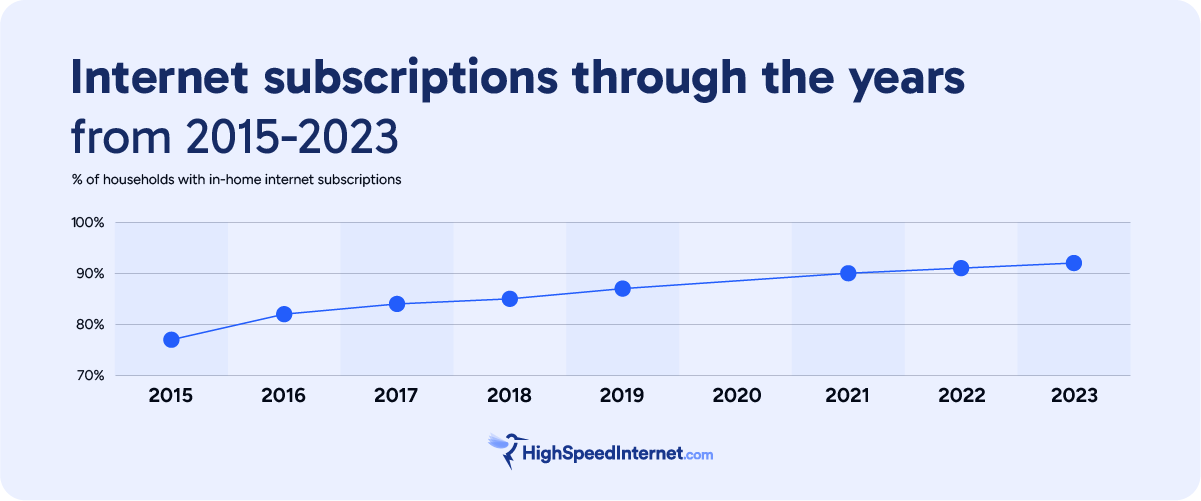
- 92% of Americans subscribe to a home internet service.
- 96% of Americans have access to a home computer.
- 92% of people have access to a smartphone, and 9.9% use only that smartphone to connect to the internet.
- 64% of people have access to a tablet, and 0.7% use only that tablet to connect to the internet.
- 4% of Americans lack computer access at home, equating to around 5 million people. However, nearly 8% of Americans lack home internet.
Internet users by connection type
There are five main types of home internet connection, and the type you have is the most important factor in your internet experience. Fiber and cable internet connections mean smoother streaming, faster uploads and downloads, better gameplay, and better live video chat. DSL, dial-up, and some satellite and fixed wireless connections mean more outages, laggy gameplay, unreliable bandwidth, and long waits for buffering.
Here’s a quick primer on internet tech types:
Fiber internet: The fastest and most reliable connection type, with infrastructure in about 49% of areas tracked by the FCC.
Cable internet: Fast internet with good download speeds but less reliability and occasional congestion, with infrastructure in about 82% of areas tracked by the FCC.
Fixed wireless internet: Internet that uses radio waves (including those from 5G or 4G LTE cell towers) to connect homes over the air, with infrastructure in about 82.3% of areas tracked by the FCC.
DSL internet: Slower, older internet that uses copper phone wires to connect customers to the internet, with infrastructure in about 41% of areas tracked by the FCC. Dial-up internet is the feeble great grandparent of DSL, but it’s almost entirely obsolete.
Satellite internet: Internet that uses ground stations, satellites in space, and small, personal receiver dishes. Minimal public infrastructure is required, but costs are high and speeds vary widely. Availability is nearly universal.
Infrastructure aside, here’s how Americans connect to the internet:
- 92% have a home internet subscription. Of those, 76.3% of internet users connect via broadband, fiber, or DSL.
- 86.8% have a cellular data plan, while 11.9% have only a cellular data plan (no home internet).
- 11.2% of people use fixed wireless internet.
- 6.6% of people have satellite internet service.
- 0.1% still rely on dial-up internet.
The cost of internet in America
Just as speeds and internet types vary based on where you live, so do costs. Usually, people in cities and suburbs pay a little less for high-speed internet because infrastructure is better and providers have more competition. Families in rural areas pay more for lower-quality connections, both in terms of monthly payments and costs compared to household income.
How internet costs compare in rural vs. urban areas
| Location | Internet type | Median annual household income | Average advertised price of internet every month | Average monthly income compared to average internet price |
|---|---|---|---|---|
| Inside a metro area | Fiber | $83,590 | $85 | 1.22% |
| Inside a metro area | Cable | $83,590 | $59 | 0.84% |
| Inside a metro area | 5G or LTE | $83,590 | $67 | 0.96% |
| Outside a metro area | Fixed wireless (not 5G or LTE) | $62,520 | $72 | 1.38% |
| Outside a metro area | DSL | $62,520 | $60 | 1.15% |
| Outside a metro area | Satellite | $62,520 | $121 | 2.32% |
- The cheapest internet type for families in cities and suburbs is cable internet, ringing in at 0.84% of average household income before taxes.
- The most expensive internet type for families in rural areas is satellite internet, ringing in at a whopping 2.8% of average household income before taxes.
- 1 in 3 Americans believe the cost of their internet service is not reasonable for the quality of the service they received.
- Roughly 8.25 million people do not know what they are paying for their internet.
The average monthly cost of internet in the U.S. is $77.
Average monthly price* of internet by connection type
- The average price of DSL is $60
- The average price of 5G home internet is $67
- The average price of fixed wireless internet is $72
- The average price of cable internet is $59
- The average price of fiber internet is $85
- The average price of satellite internet is $121
- The average price of all advertised internet plans in the U.S. is $77
*Figures calculated based on advertised price of all packages offered by internet providers, not counting charges for equipment, installation, and fees. Households may pay more or less depending on which plan they choose, whether they’re on a promotion, or if they use their own Wi-Fi equipment.
Bundling in 2025
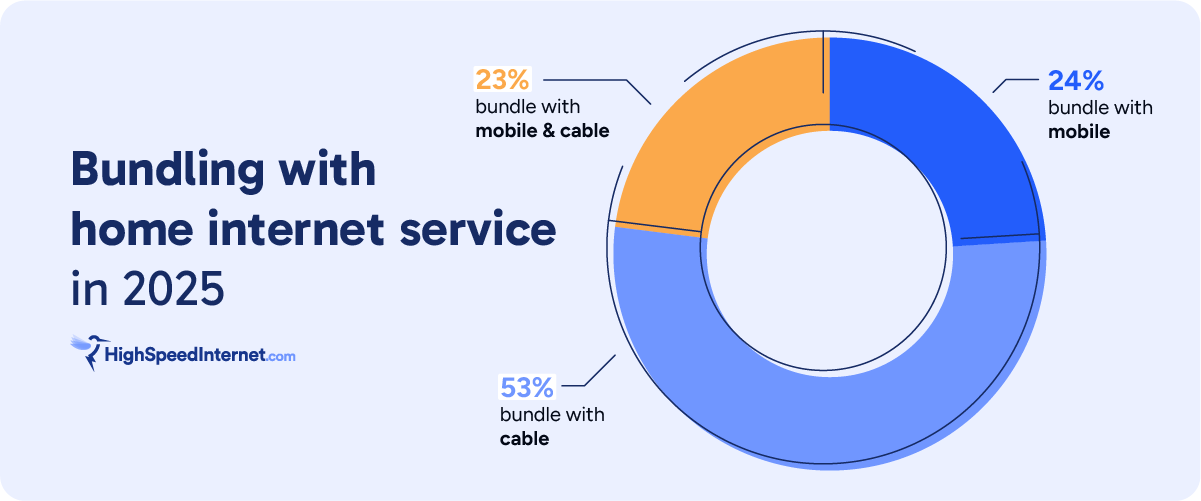
You can often save money by choosing TV, internet, and mobile services from the same company. These deals are becoming more popular but aren’t universal. We found that 47% of Americans bundle their internet package with either mobile phone service or cable TV service. Of those customers:
- 24% bundle with mobile
- 53% bundle with cable
- 22% bundle with both mobile and cable
Internet and income
The median household in a metro area brings in about $83,590 per year—about 25% more than the median household income in a non-metro area. Nevertheless, rural families tend to pay more for internet service than their counterparts in cities and suburbs.
This lack of affordable access has led to massive amounts of federal funding allocated to rural areas, but affordable access is complicated. While it’s true that incomes are lower and prices are higher for internet access in rural areas, more households in urban areas fall below poverty thresholds.
High costs and skills gaps harm accessibility everywhere, but lack of public infrastructure is a big problem in rural areas. In urban and suburban areas, access may also be limited by congestion and lack of competition within condo and apartment buildings.
Here’s what the census data shows (regardless of urban or rural status):
- 22% of people with annual incomes less than $20,000 do not have a home internet connection.
- 10% of people with incomes of $20,000–$74,999 annually do not have an internet subscription.
- 3% of Americans with incomes higher than $75,000 annually do not have an at-home internet subscription.
We publish annual reports about the state of the internet, and our expert team found the best value for internet plans is around $50 per month, but the most popular plans go for around $70 per month. We recommend speeds of about 100Mbps for households of one or two people and speeds of around 250–500Mbps for larger households.
Pro tip: Don’t overspend on speed
Plans with speeds of 1Gbps or faster are widely available, but we don’t usually recommend them. There’s no reason to pay for more bandwidth than you can use!
How to find the best deal on internet service in your area
Your choices for internet service depend on your exact address, so the best way to find a great deal on internet service is to get a list of internet providers near you.
Want a list of providers in your area?
Enter your zip code to shop and compare.
How people use the internet in 2024
Whether it’s connecting to a friend, checking on a medical test result, or catching up on the latest Netflix craze, nearly every facet of modern life relies on internet connectivity. It’s important to understand how the digital shift impacts us individually and as a whole.
Daily internet use in the U.S.
We asked Americans to estimate how much time they spend online, and here’s what we found:
Americans spend an average of 5.5 hours online every day, outside of work.
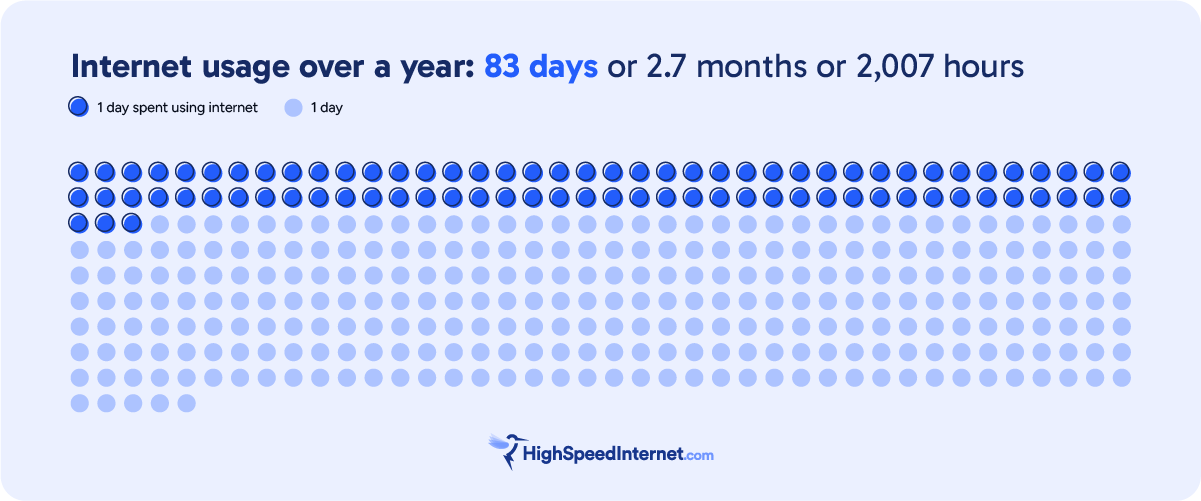
Average time each American spends online in a year
- 2,007 hours
- 2.7 months
- 83 days
Average time each American spends online in a lifetime
- 118,442 hours
- 4,935 days
- 13.4 years
The average American spends 118,442 hours (4,935 days, 13.4 years) online in a lifeline.
How long can you live without the internet?
- 23% said they can go only four hours or less without needing internet access.
- 19% said they can go only 24 hours or less without needing internet access.
- 19% of people said 24 hours is the longest they’ve ever gone without accessing the internet
Nearly 1 in 5 Americans cannot go more than 1 hour without needing internet access.
Work
- 19.5% of Americans work from home, according to the Bureau of Labor Statistics.
- 62% of Americans rely on a high-speed internet connection for their livelihood and income, according to our survey data.
- About half the people we surveyed said they work online for less than 20 hours per week, but 15% of people said they work online 30–40 hours per week. Another 15% said they work online more than 40 hours per week.
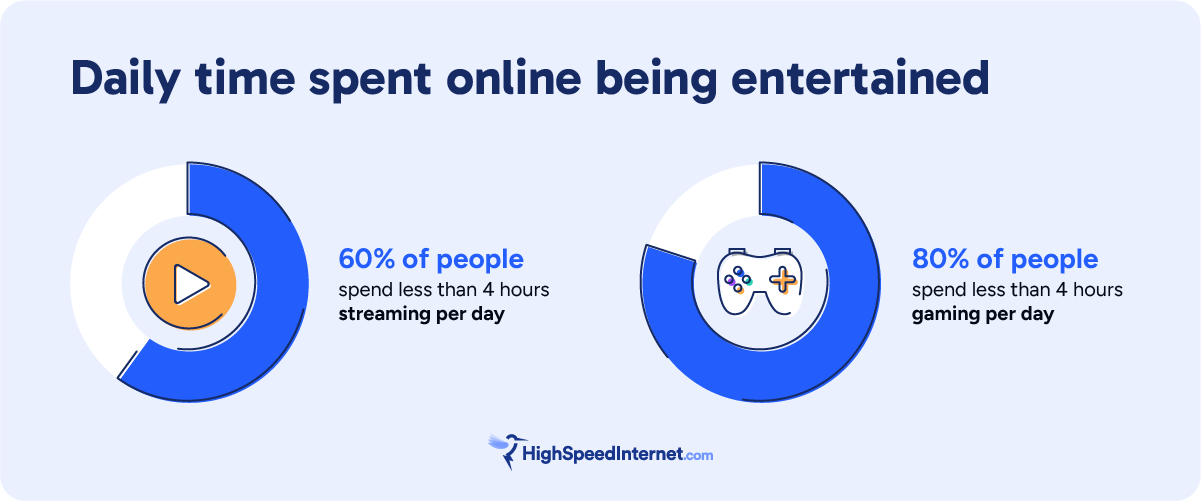
Entertainment
- 40% of Americans spend more than four hours a day streaming TV or movies.
- 20% of Americans spend more than four hours a day gaming.
Online usage by device
With all that time spent online, we were surprised to learn only about half of all non-work internet access takes place on personal smartphones. Here’s a rundown of the devices people said they use most often:
- 52% choose their smartphones first
- 38% choose their laptops first
- 10% choose another connected device first
Online usage by activity
We know that internet access is key to modern life, but we wanted to learn more about what people use the internet for in 2024. Our findings dovetail with a recent analysis by Meltwater, which found three main themes: information, connection, and entertainment.
Top reasons Americans use the internet, across generations:
- Finding information: 75%
- Researching how to do things: 66.9%
- Staying in touch with friends and family: 64.4%
- Keeping up to date with news and events: 59.1%
- Researching products and brands: 58.9%
- Watching videos, TV shows, or movies: 56.6%
- Accessing and listening to music: 51%
- Finding new ideas or inspiration: 48.6%
Other top reasons included studying, managing finances, and planning travel. Surprisingly, only 30% of people said gaming was a primary reason to use the internet.
Conclusion: Everyone deserves affordable access
We research, write about, and promote internet service because the internet is nothing short of extraordinary. It’s a gateway to all the world’s knowledge, an unprecedented tool for global connection, and a platform for art and music beyond the wildest dreams of our ancestors.
We believe everyone deserves access to the wonders of modern technology, and we believe they should get the best possible price for high-quality home services. In short, it pays to shop around.
We plan a big update to this report about once a year, and we’ll make smaller updates as new research emerges. If you ask me, it’s not a bad idea for you to shop for internet service about once a year too.
Author - Chili Palmer
Chili Palmer covers home tech services, with a special focus on understanding what families need and how they can stay connected on a budget. She handles internet access and affordability, breaking news, mobile services, and consumer trends. Chili’s work as a writer, reporter, and editor has appeared in publications including Telecompetitor, Utah Business, Idaho Business Review, Benton Institute for Broadband & Society, and Switchful.com.
Editor - Jessica Brooksby
Jessica loves bringing her passion for the written word and her love of tech into one space at HighSpeedInternet.com. She works with the team’s writers to revise strong, user-focused content so every reader can find the tech that works for them. Jessica has a bachelor’s degree in English from Utah Valley University and seven years of creative and editorial experience. Outside of work, she spends her time gaming, reading, painting, and buying an excessive amount of Legend of Zelda merchandise.


